Case study diagrams
The figures from both cases, at full size. Each one argues the turn its case rests on, so the short account here is the argument rather than a caption.
01 · Enrollment Framework
The convergence
Three requests reached the company through three different doors, each looking like a one-off build for the customer who asked. The figure holds them side by side to show what the intake routes hid: the same underlying capability, requested three ways. Below the convergence is what got built once instead of three times, and the program that came after it, set up rather than built.
Read the Enrollment Framework case →

02 · Accounting Escalations
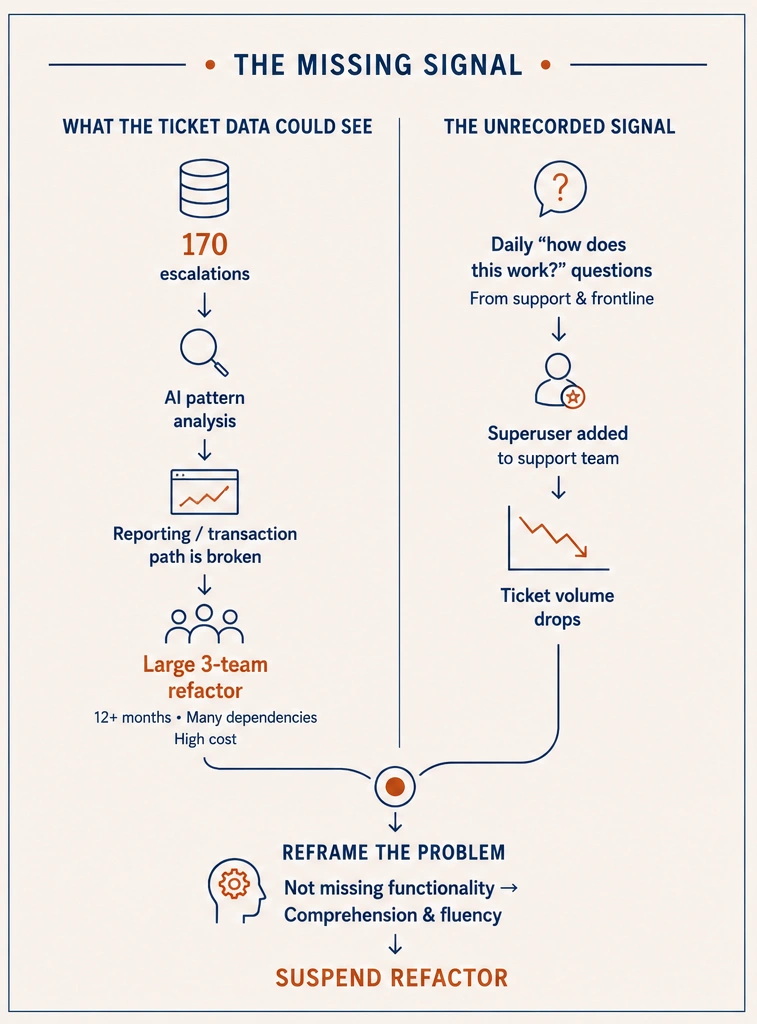
The missing signal
Two tracks descend in parallel. The left one is what the ticket data could see, and it leads cleanly to a year of structural work. The right one never enters the dataset at all, because nobody opens a ticket to say they do not understand the screen in front of them. The figure exists to show that the analysis was not wrong about its evidence, it was wrong about what its evidence could contain.
Read the Accounting Escalations case →